For many contractors, thinking about website analytics is pretty far from the literal nuts and bolts of their business. After all, so much traditional business comes from peer networking, traditional flyering and cold-calling, past business, and referrals, your web presence could seem like an afterthought. On the other hand, if you’re using a piece of contracting customer relationship management software like FieldPulse’s, we’re going to guess you’ve drank the Kool-Aid about the power, efficiency, and return on investment that digital tools provide. Google Analytics, in this sense, is just another useful tool in your arsenal. It’ll help you sell more, spend less, and get greater insight into your current and future client base. Let’s take a look at how analytics can help you be smarter about your contracting business.
See How Well Your Current Website is Performing
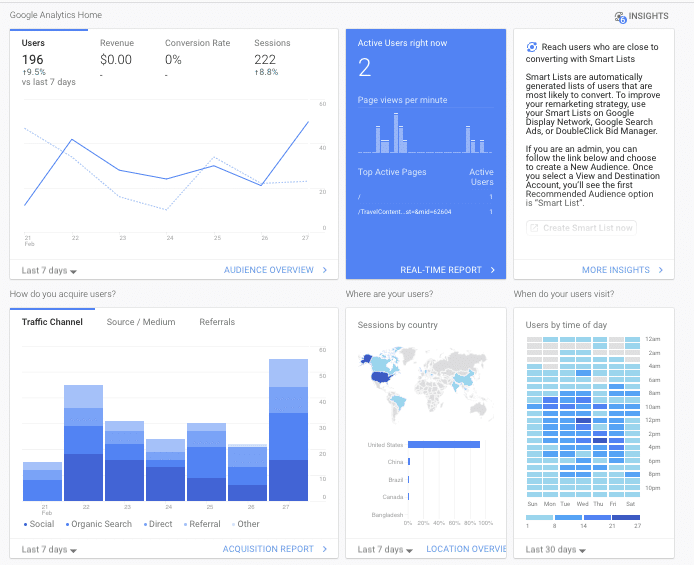
When you log into Google Analytics, the first thing you’ll see is a home page dashboard who some basic statistic, including your audience over the last week and how many active users are currently on your website. There’s a ton of good information here, including where your potential clients – your website visitors – are visiting from, from social media to country of origin, to what devices they’re using. This is all good stuff, but it requires a little more context to get the most out of it. To do that, we’re going to click on the “Audience” tab in the right sidebar and then select “Overview.”
Users, Sessions, Pageviews, and Bounce Rates

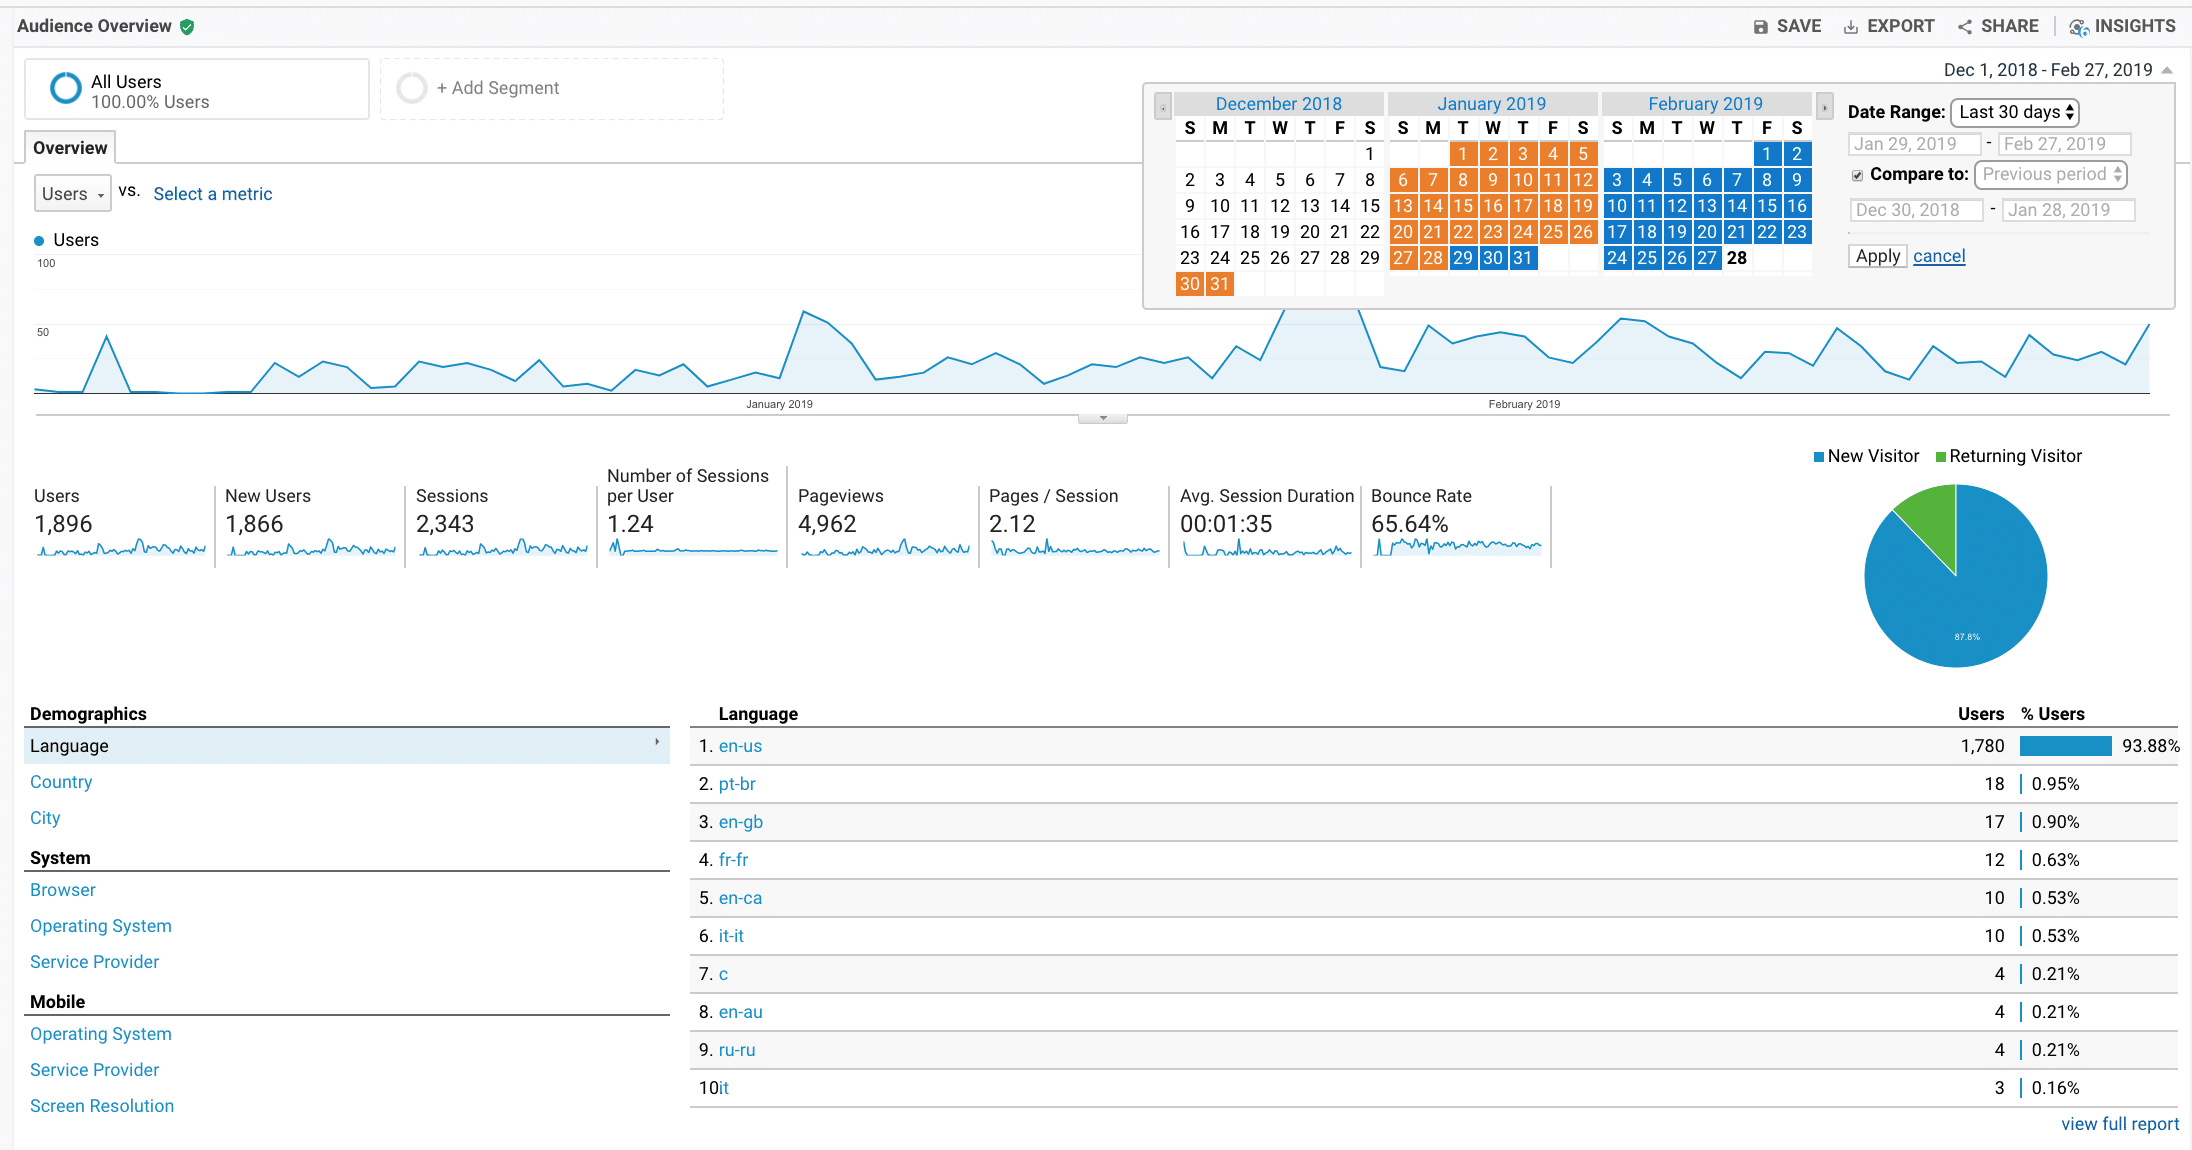
We can see a few important stats here, including how many Users have visited your website, how many of them are new, and how many Sessions. Let’s break this down a little and what it tells you about your website:New Users vs. Users: This tells you how much of your website traffic is people coming back to your website – maybe they’ve checked you out to hire you but haven’t made a decision yet – versus how much new potential business you’re bringing in. Sessions/Users Per Session: This is just what is sounds like. Sessions are how many times people come to your website. If someone visits your website just once in a given time period, that’s one session. If they visit twice, it’s two. In the graphic here we can see the average user visits the website 1.2 times in a 30-day period. Session Duration: Simply put, this is how long the average person stays on your site. Longer is usually better, since it shows a higher level of interest. Pageviews/Pages per Session: Similarly, you tend to want users to visit more pages, not less. The deeper they get into your site, the more clearly interested they are in your services. Bounce Rate: The bounce rate is the percentage of your site’s visitors that did not interact with your page at all. Lower is better, but differs by industry and what kind of efforts you’re making digitally.
See How Well Your Advertising Efforts On and Offline are Doing

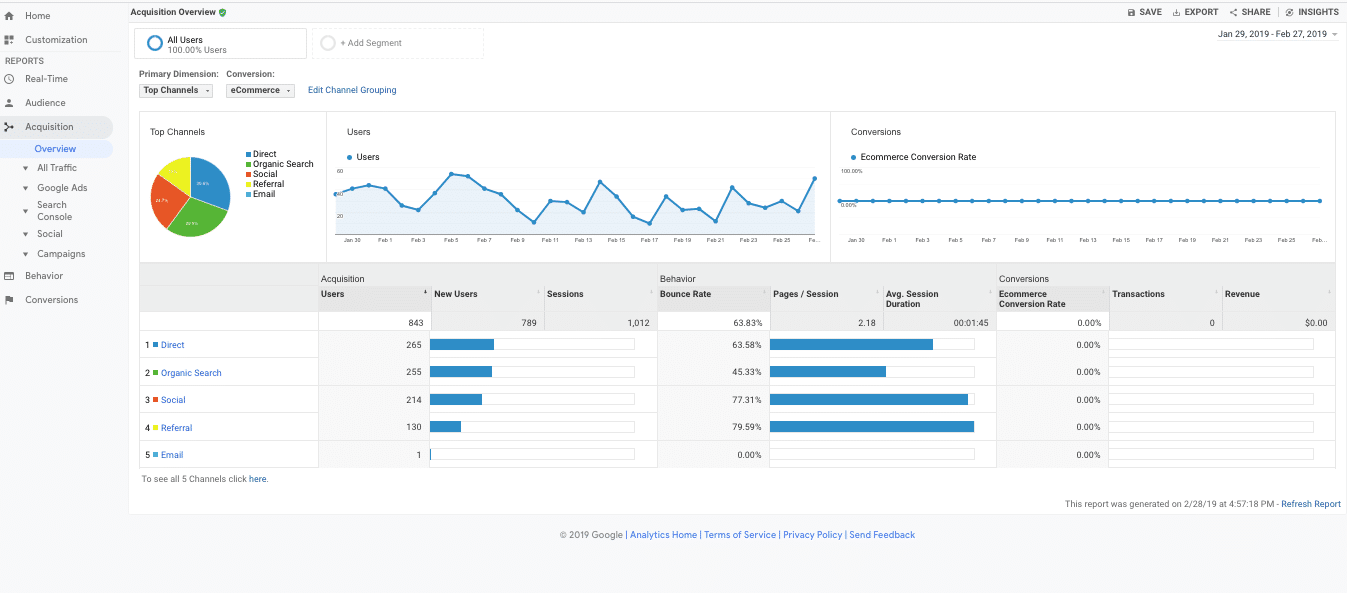
Another powerful feature of Google Analytics is the ability to see exactly how you acquire new users to your website. This is critical because it can help show you exactly how your various marketing efforts are working. Again, let’s break it down by category.Direct Traffic: These are people who type in your site name directly into their web browser bar. In other words, people who know who you are and are putting in the website from memory, from a direct mail flier, or from an in-person referral. Tracking this over time and lining them up with your offline efforts can give you clues to how those efforts are succeeding. Organic Search: Organic search traffic comes from Google. If you’re an roofer in Lake Vista and they type in “roofers lake Vista” in search and find your site in result and click through, that’s organic search.This search traffic will also include people who searched your company name but didn’t remember your web address, which can also indicate some offline marketing/brand awareness success.Social: Social traffic includes all your traffic from social media. Facebook, Instagram, Twitter, Pinterest, and so on. Clicking on this will break that traffic down by platform. Referral Traffic: Referral traffic refers to links people click to your website from other websites. If someone linked to your on their blog, or clicked through from their lead generation site, their traffic would show up here. This is a good sign if your partnerships and third-party services are working for you.Email: Do you do email marketing? If so, this channel’s another way to track your email traffic. This is extra important if you outsource email marketing (say by putting an ad in someone else’s newsletter), so you can verify their numbers for yourself.Track Your Progress Over Time and Identify Trends

Just looking at the numbers in a given week or month doesn’t tell you much, however. Instead, the best way to track your progress is by comparing different time periods together. Each “overview” label in the sidebar in each category lets your select a date range for a given data set and compare it to the previous period. This will enable you to track performance month over month as well as quarter to quarter and year over year. It will also let you compare the correlation between web traffic and sales in a given frame.That’s another way to compare your various marketing efforts as well as the ebbs and flow of the market itself. That can help you make smarter decisions about when and where to spend your marketing dollars for maximum effect.
The Tip of the Iceberg
All of this is just the tip of the proverbial iceberg with Google Analytics.You can extract powerful data by setting up custom conversions for lead submissions, using the platform to track Google Ads, set up custom campaigns, and so much more. You can also explore exactly how users navigate your website (User Flow) as well as audience Demographics, Interests, and others. To get truly expert you may need to hire an outside specialist, but for now, this is more than enough to help you intelligently use analytics to your sales and marketing advantage.
